掛Apache , 顧名思義 , 它是屬於Apache基金會的產物 , 用來測試功能面操作的執行效能 , 以下是來自官方網站對它的定義 . 他並不侷限一定要Apache主機上運行的服務 , 而是針對協定
The Apache JMeter™ application is open source software, a 100% pure Java application designed to load test functional behavior and measure performance. It was originally designed for testing Web Applications but has since expanded to other test functions.
這邊是以MAC執行畫面作為範本
Apache JMeter may be used to test performance both on static and dynamic resources (Webservices (SOAP/REST), Web dynamic languages – PHP, Java, ASP.NET, Files, etc. -, Java Objects, Data Bases and Queries, FTP Servers and more). It can be used to simulate a heavy load on a server, group of servers, network or object to test its strength or to analyze overall performance under different load types. You can use it to make a graphical analysis of performance or to test your server/script/object behavior under heavy concurrent load.
Apache JMeter features include:
- Ability to load and performance test many different server/protocol types:
- Web – HTTP, HTTPS
- SOAP / REST
- FTP
- Database via JDBC
- LDAP
- Message-oriented middleware (MOM) via JMS
- Mail – SMTP(S), POP3(S) and IMAP(S)
- Native commands or shell scripts
- TCP
- Complete portability and 100% Java purity.
- Full multithreading framework allows concurrent sampling by many threads and simultaneous sampling of different functions by separate thread groups.
- Careful GUI design allows faster Test Plan building and debugging.
- Caching and offline analysis/replaying of test results.
- Highly Extensible core:
- Pluggable Samplers allow unlimited testing capabilities.
- Several load statistics may be chosen with pluggable timers.
- Data analysis and visualization plugins allow great extensibility as well as personalization.
- Functions can be used to provide dynamic input to a test or provide data manipulation.
- Scriptable Samplers (BeanShell, BSF-compatible languages and JSR223-compatible languages)
這邊是以MAC執行畫面作為範本
- 下載頁在這 :http://jmeter.apache.org/download_jmeter.cgi
- 請下載Binaries版本 : apache-jmeter-3.0
- 3.0更新的功能 : https://dzone.com/articles/apache-jmeter-30-whats-new
- 解壓縮 , 開Terminal , 找到bin資料夾 , 執行 : sh ./apache-jmeter-3.0/bin/jmeter.sh , 開啟GUI畫面
成功的話 , 你會看到下面畫面 , 就可以開始新增測試腳本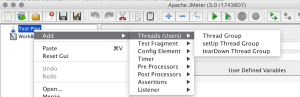
- 左邊這邊有很多項目 , 由上而下是一個測試流程 , 把開啟畫面 / 登入 / 畫面切換 / 登出 , 都當作一個項目以網站來說 , 我們通常是測一個流程 , 模擬使用者的操作行為 , 並把這行為用模擬方式放大數量去執行 , 就是想體驗一下當大量的使用量進來到系統以後 , 會發生怎樣的狀況? 例如 : 記憶體破碎?
- 嚴格說起來 , 這樣的測試 , 分為三種 : 效能測試 , 負載測試 , 壓力測試 , 各自肩負一個使命
http://www.prudentman.idv.tw/2011/01/performance-vs-load-vs-stress-testing.html - 情境1 : 當如果今天系統回應時間已經超過5秒(基本上, 3秒就快抓狂), 這時候即使測試到同步上線人數到達2萬人 , 這數據可能就只能變成參考 , 雖然確保系統可以承受 , 但是並不是最佳的同步上限人數極限可能要往回推 , 找到超過3秒的那個人數值
- 情境2 : 我不確定我的系統遇到大量使用者登入 , 如果Crash會發生什麼事情?主機重開?負載平衡機器比服務主機先掛掉? 還是硬體還很多資源的情況下 , 網站服務就已經先掛掉了?
- 情境3 : 在情境1找到目前系統最佳的上線人數 , 建議試著把施打時間延長 , 看看系統是否可以長時間保持穩定 , 最常見的就是程式在記憶體的使用上是否有濫用的狀況

補充說明
- 錄製腳本的輔助工具 :http://www.badboy.com.au/ , https://addons.mozilla.org/en-US/firefox/addon/jmeter/
- 因為剛好系統有用到Nginx , 必須要先關掉這個防護機制 , 將單一IP的需求量設定到至少超過1000
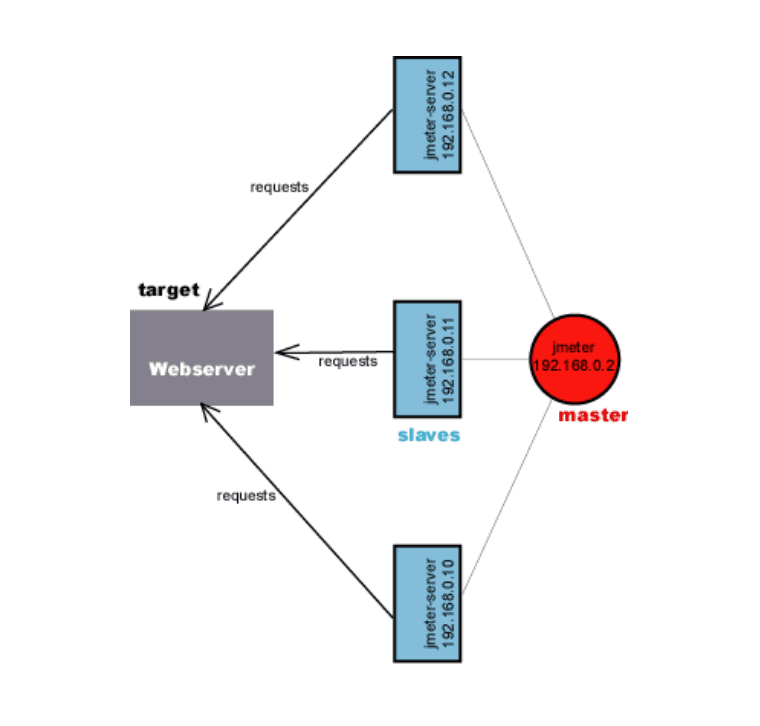
http://nginx.org/en/docs/http/ngx_http_limit_conn_module.html - 理想情況 , 必須要用多台發送端 , 畢竟透過單一主機施打 , 會有封包傳送的延遲 , 模擬效果比多台差
http://jmeter.apache.org/usermanual/jmeter_distributed_testing_step_by_step.pdf
準備打測試前 , 必須要先跟IDC確定整體網路環境 , 如果是區網直接打 , 可能還好 - 內網 : 一般區網都是Cate5e等級以上 , 不會是瓶頸點 , 但是當RAM飆高後 , 吃到硬碟SWAP , 反而很容易影響到同一台實體機上面的VM主機
外網 : 外網的情況 , 通常會先把公司對外頻寬吃光 , 再來是流量有可能被防火牆或負載平衡器阻隔 , 可能要協調暫時性的關閉 , 才能測到服務機器真正的瓶頸點